
Записатися на безкоштовне пробне заняття


Одним из письменных заданий международного экзамена IELTS (Academiс) является описание графиков, таблиц, диаграмм, схем, карт. Описание графиков IELTS требует знания шаблона, согласно которому вы будете следовать, подставляя данные из заданной диаграммы или таблицы.
Однако без специфической лексики будет сложно заполнять какой бы то ни было образец-шаблон. Поэтому запаситесь терпением и, главное, желанием запомнить базовую лексику, полезные фразы и обороты, которыми необходимо будет оперировать при описании графиков IELTS. Итак, рассмотрим разные варианты графиков, которые встречаются на экзамене IELTS и ряд подготовительных упражнений, выполнив которые вы сможете сформировать навыки описания графиков IELTS.
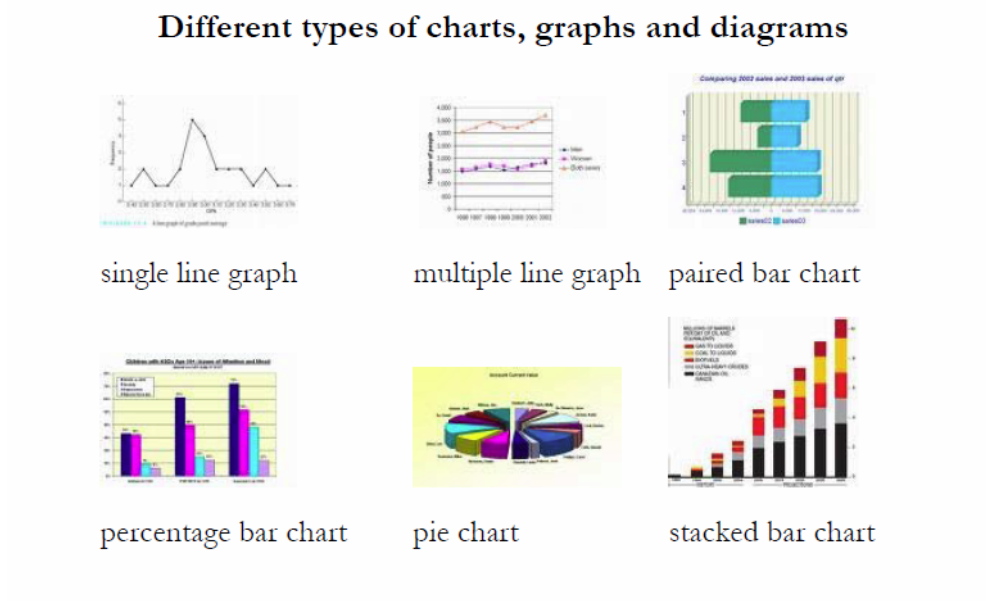
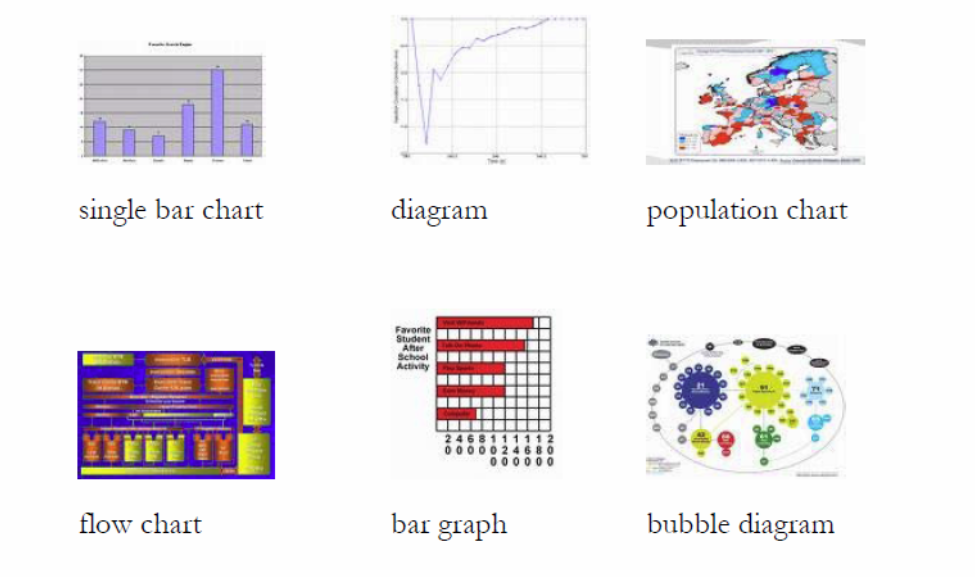
Task 1. Learn useful vocabulary 1.
a paired bar chart — парная гистограмма, столбиковая диаграмма
a pie chart — круговая диаграмма
a stacked bar chart — составная столбиковая диаграмма
a diagram — диаграмма, график
a flow chart — блок-схема
a bar graph — столбиковая диаграмма
a bubble diagram — диаграмма состояний
Task 2. Name the kinds of charts you can see.
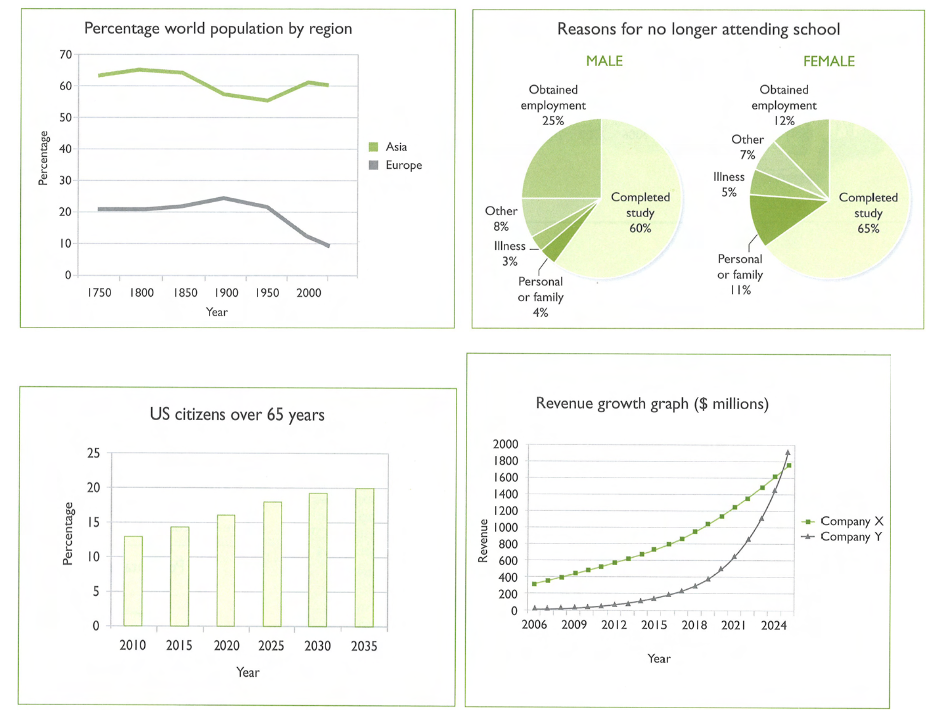
Answers:
| 1. | 2. | 3. | 4. |
| a multiple line graph | pie charts | a bar chart | a multiple line graph |
Task 3.
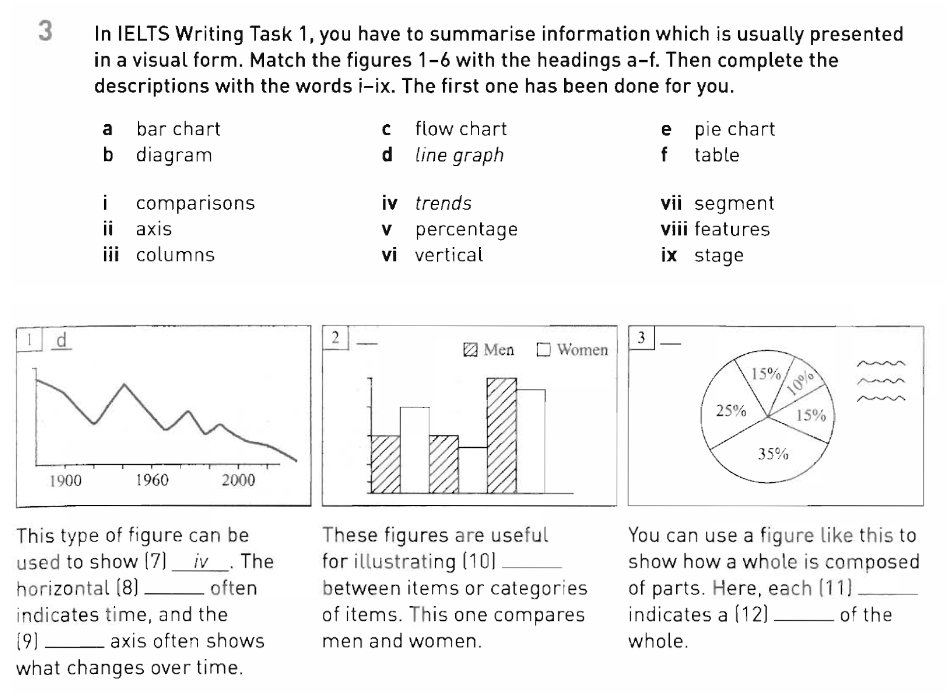
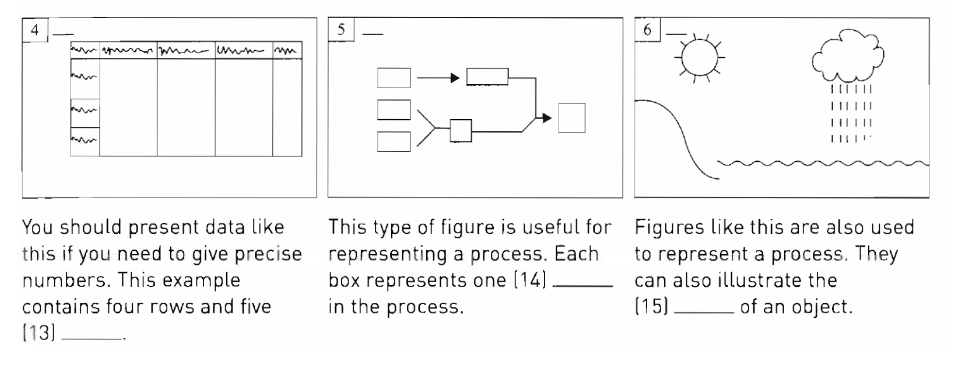
* datum — singular form of DATA
Answers:
| 1. | 2. | 3. | 4. | 5. | 6. | 7. | 8. | 9. | 10. | 11. | 12. | 13. | 14. | 15. |
| d | a | e | f | c | b | iv | ii | vi | i | vii | v | iii | ix | viii |
Task 4. Learn useful vocabulary 2.
to level off = level out — выравнивать, делать ровным; выравниваться
to fluctuate (fluctuation — n) — колебаться (колебание)
to dip — падать, снижатьтся
to plunge — резко снижаться
to soar — стремительно расти
to surge — резко увеличиться
to plummet — резко уменьшаться
Task 5.
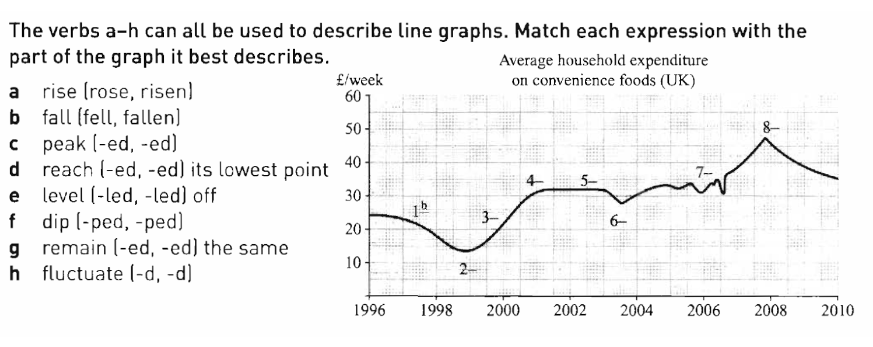
Answers:
| 1. | 2. | 3. | 4. | 5. | 6. | 7. | 8. |
| b | d | a | e | g | f | h | c |
Task 6.
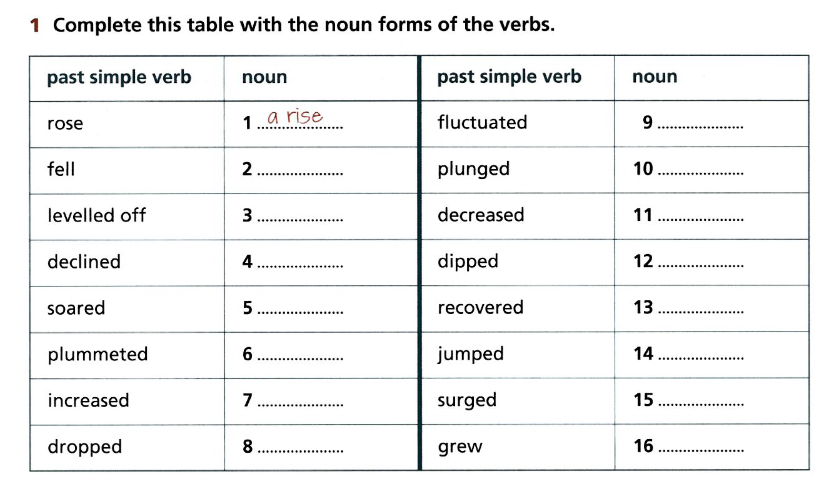
Answers:
| 2. | a fall |
| 3. | a levelling-off |
| 4. | a decline |
| 5. | a soar |
| 6. | a plummet |
| 7. | an increase |
| 8. | a drop |
| 9. | a fluctuation |
| 10. | a plunge |
| 11 | a decrease |
| 12. | a dip |
| 13. | a recovery |
| 14. | a jump |
| 15. | a surge |
| 16. | growth |
Task 7. Learn useful vocabulary 3.
gradual- постепенный
steep — крутой
moderate — умеренный
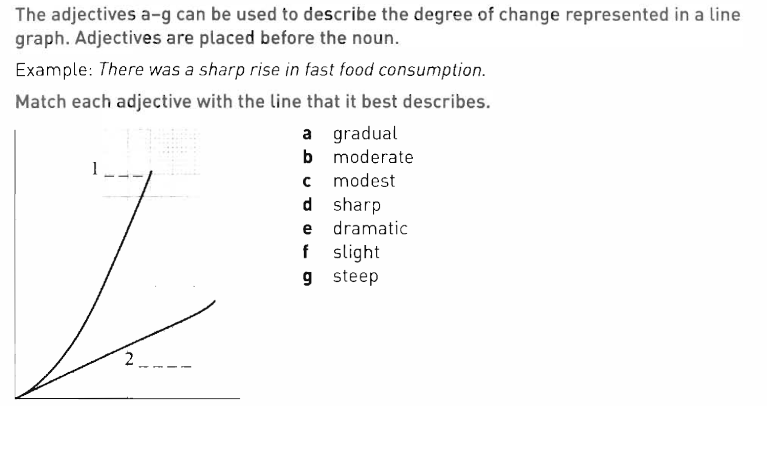
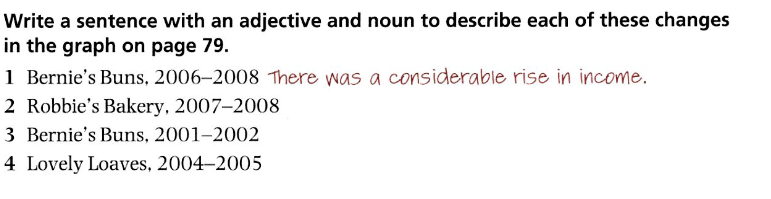
Task 8.
Answers
| 2. | There was a sharp increase in income. |
| 3. | There was a slight decline in income. |
| 4. | There was a sharp fall in income. |
Task 9. Learn useful vocabulary 4.
marginally — немного, едва
negligibly — весьма незначительно
remarkably — значительно
steadily — непрерывно
strikingly — поразительно
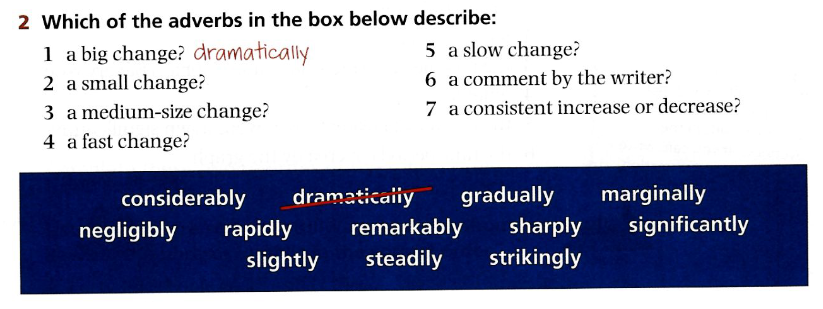
Task 10.
Answers:
| 1. | slightly, marginally, negligibly |
| 2. | significantly, considerably |
| 3. | sharply, rapidly |
| 4. | gradually |
| 5. | remarkably, strikingly |
| 6. | steadily |
Task 11.
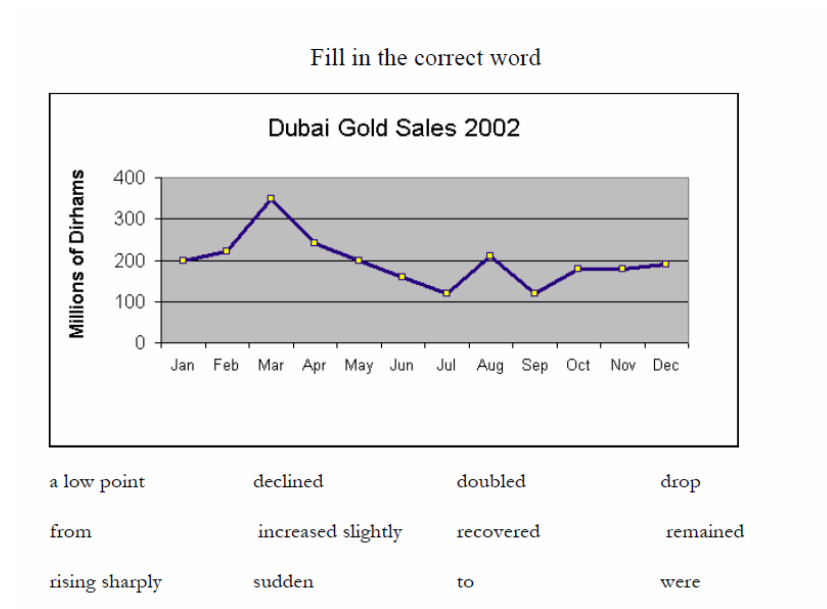
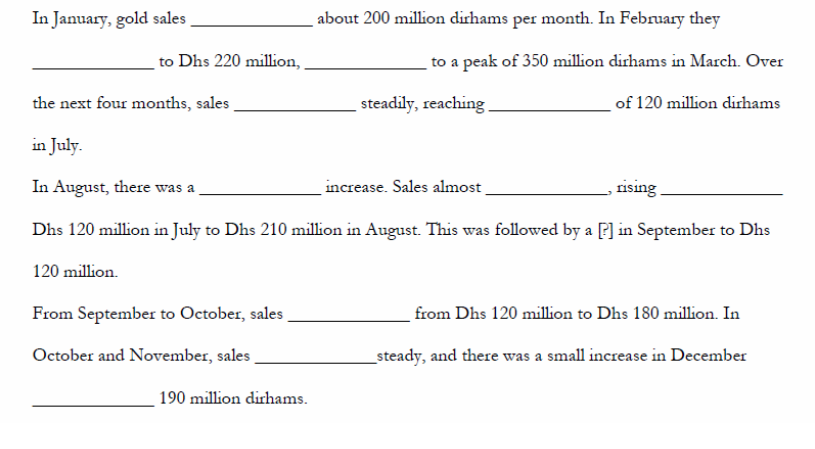
Answers:
| 1. | were |
| 2. | increased slightly |
| 3. | rising sharply |
| 4. | declined |
| 5. | a low point |
| 6. | sudden |
| 7. | doubled |
| 8. | from |
| 9. | recovered |
| 10. | remained |
| 11. | to |
Task 12.
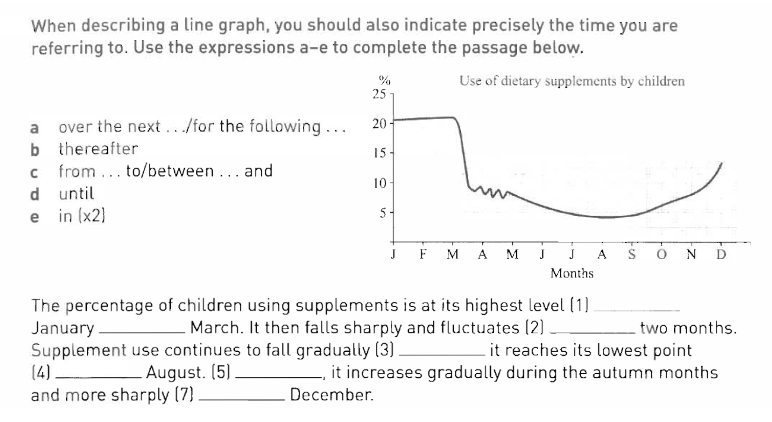
Answers:
| 1. | 2. | 3. | 4. | 5. | 6. |
| c | a | d | e | b | e |
Task 13.
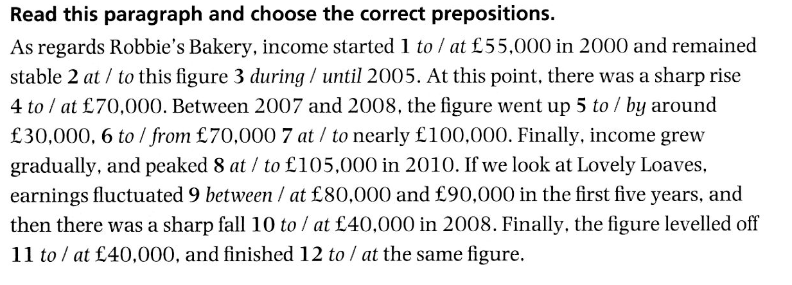
Answers:
| 1. | 2. | 3. | 4. | 5. | 6. | 7. | 8. | 9. | 10. | 11. | 12. |
| at | at | until | to | by | from | to | at | between | to | at | at |
Task 14.
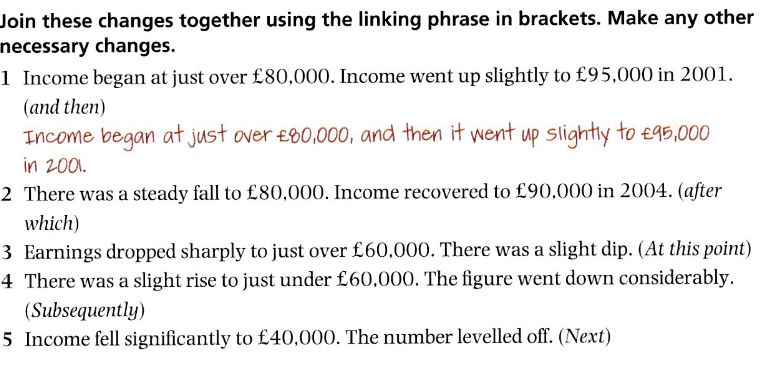
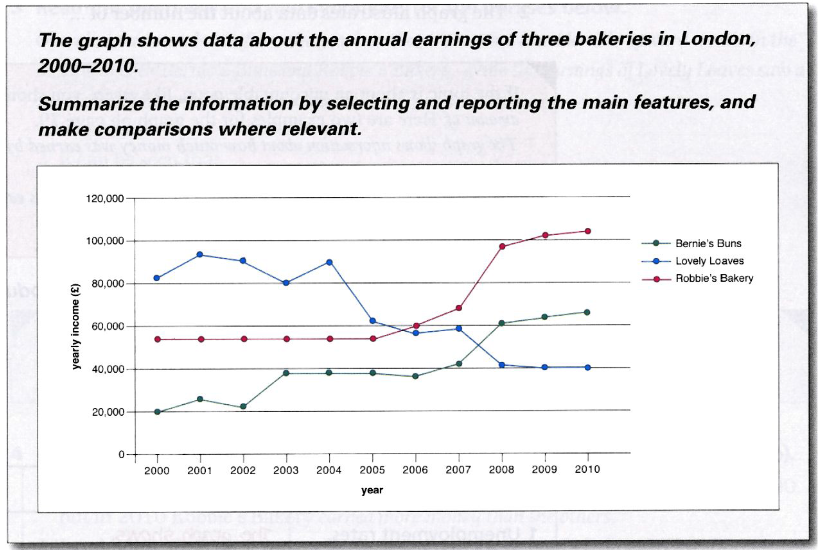
Answers:
| 2. | There was a steady fall to 80 000 pounds, after which income recovered to 90 000 pounds in 2004. |
| 3. | Earnings dropped sharply to just over 60 000 pounds. At this point, there was a slight dip. |
| 4. | There was a slight rise to just under 60 000 pounds. Subsequently, the fiigure went down considerably. |
| 5. | Income fell significantly to 40 000 pounds. Next, the number levelled off. |
Task 15.
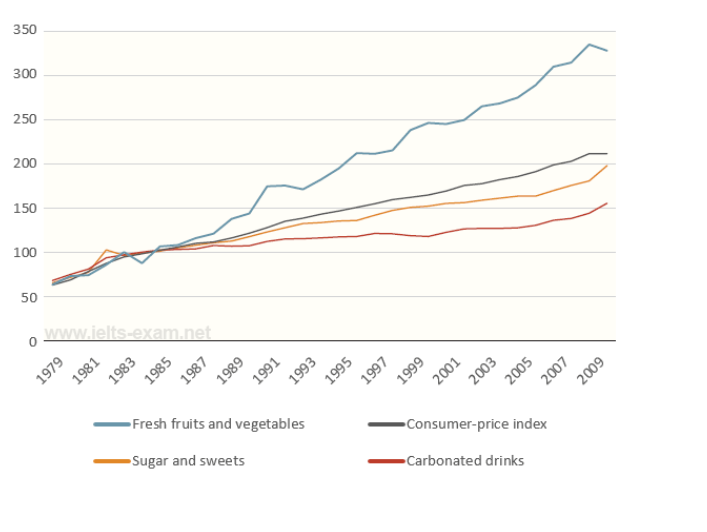
The graph below shows relative price changes for fresh fruits and vegetables, sugars and sweets, and carbonated drinks between 1978 and 2009. Summarise the information by selecting and reporting the main features, and make comparisons where relevant.
Data are from the Bureau of Labor Statistics and represent the U.S. city averages for all urban consumers in January of each year.
Periodic — периодический, циклический
Temporarily — временно
Read the following model answer. Complete the answer by filling the gaps with a word from the box below.
| periodic | temporarily | and | steadily | from |
| period | remained | steady | by | trend |
Model answer
The graph shows changes in the price of fresh fruits and vegetables, sugar and sweets, and carbonated drinks over a thirty-year …..period.…. in the US between 1979 …..and….. 2009. The graph also shows the general ….trend…… in the consumer price index during this time.
While the consumer price index showed a slow and …..steady….. increase from 1979 to 2009, the same cannot be said for the price of carbonated, or soft drinks. After rising briefly between 1979 and 1981, they ….remained…… fairly constant until 1999, when the price did begin to increase slowly.
In contrast, there was a marked difference in the price of fresh fruits and vegetables, which, despite…..periodic….. fluctuations, rose ….steadily.….. throughout this period. In fact, fresh food prices only levelled out….temporarily…… between 1990 and 1992 and again …..from.…. 2000 to 2001. However, …..by….. 2008 the price had increased by more than 300%.
Hometask:
1. Learn new words
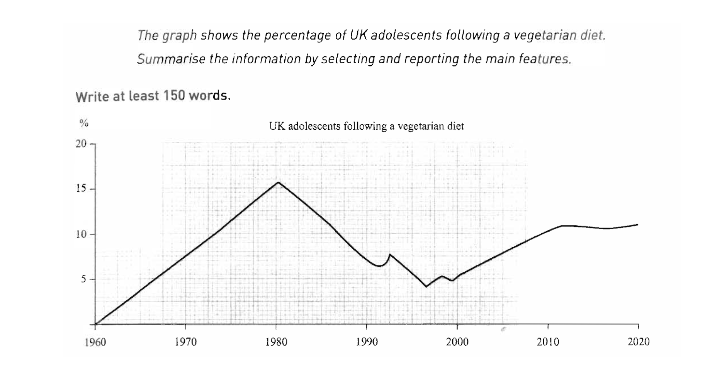
2. Describe the graph below
Model answer:
Over the past fifty years, there has been significant variation in the percentage of young people in the UK who choose to eat a vegetarian diet.
In 1960, only a small percentage of adolescents (about 1 percent) were vegetarian. There was then a steep increase until 1978, when over 15 per cent were following a vegetarian diet. Thereafter, the percentage fell steadily until 1990 and then fluctuated for a decade. It reached a low point of just 4 per cent in 1996. It has risen gradually since 2000 and is expected to continue to do so over the next few years. After reaching a high point in around 2015, it is projected to decline again and possibly level off by the decade’s end.
Overall, the graph shows two main periods of interest in vegetarianism among young people in the UK : one peaking around 1978 and the second projected to peak approximately forty years later, in 2015.
Материал, представленный в этой статье в виде занятия, нацеленного на формирование навыков описания графиков IELTS, скомбинирован из разных учебников (Collins, IELTS Advantage Writing Skills, PTE Academic Practice Tests) и образовательных сайтов по подготовке к IELTS преподавателем онлайн-школы English Voyage Марией.
Другие статьи Марии:
Как написать письмо на английском
Описание графиков IELTS
 E-mail
 RSS-лента
Здравствуйте, пожалуйста, исправьте ошибки tast 7.
1.
Steep означает sharp, abrupt( резкий, крутой, внезапный) но не gradual(постепенный)
2.
Slight означает minor, insignificant( незначительный, слабый) но не moderate( умеренный)
Спасибо
Спасибо!
Спасибо за уточнения!